 /* Code Comments */
using the node inspector
2019-11-19
|~2 min read
|217 words
If you’re running a node application and you want to debug, but don’t want to use the debugger in your text editor, perhaps your text editor doesn’t have a debugger, or maybe you just miss the Chrome dev tools, there’s a solution: use the --inspect flag.
The steps:
-
Start your
nodeapp with the—-inspectflag. So, if you normally start your app withnode app.js, not it’snode --inspect app.jsYou should see a print out similar to the following:
Debugger listening on ws://127.0.0.1:9229/448f8b66-e314-4a23-ba69-e7b6eff31e7b
For help, see: https://nodejs.org/en/docs/inspector
Server running at http://127.0.0.1:3000/
What this is saying is that my app is now running on port 3000, just like usual, but also that the debugger is listening on a web socket at port 9229.
-
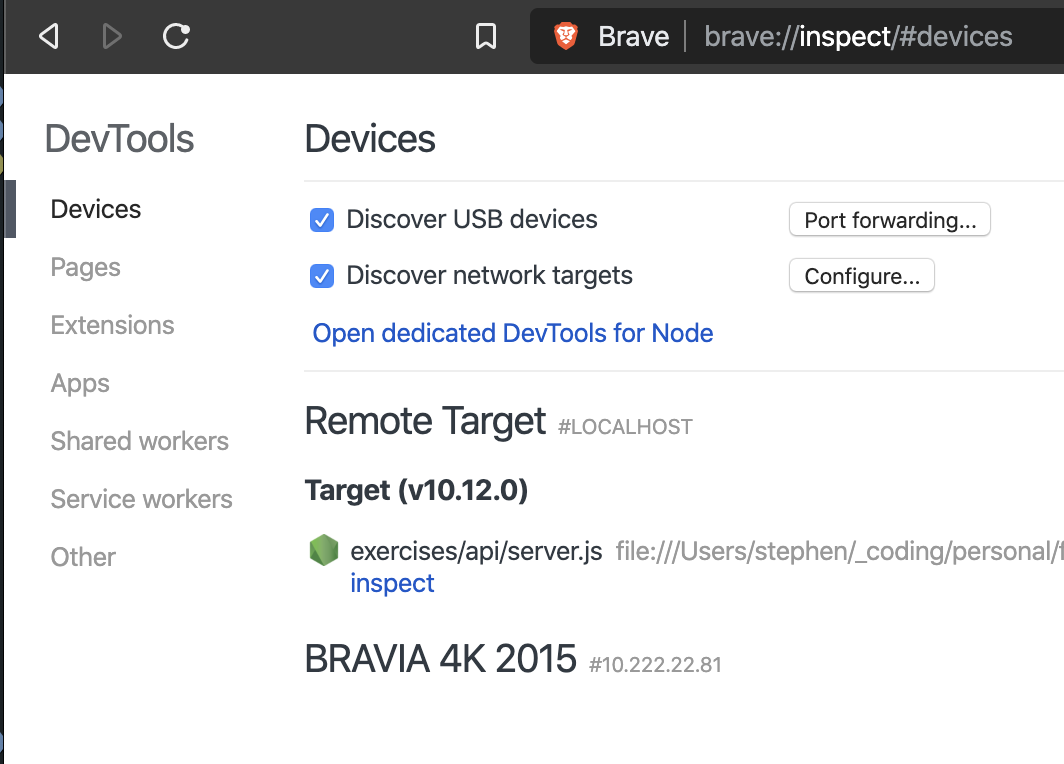
On a Chromium browser, go to
//inspect. That would bechrome://inspectorbrave://inspectif you’re on Brave, etc.You should now see a screen that looks like this:
-
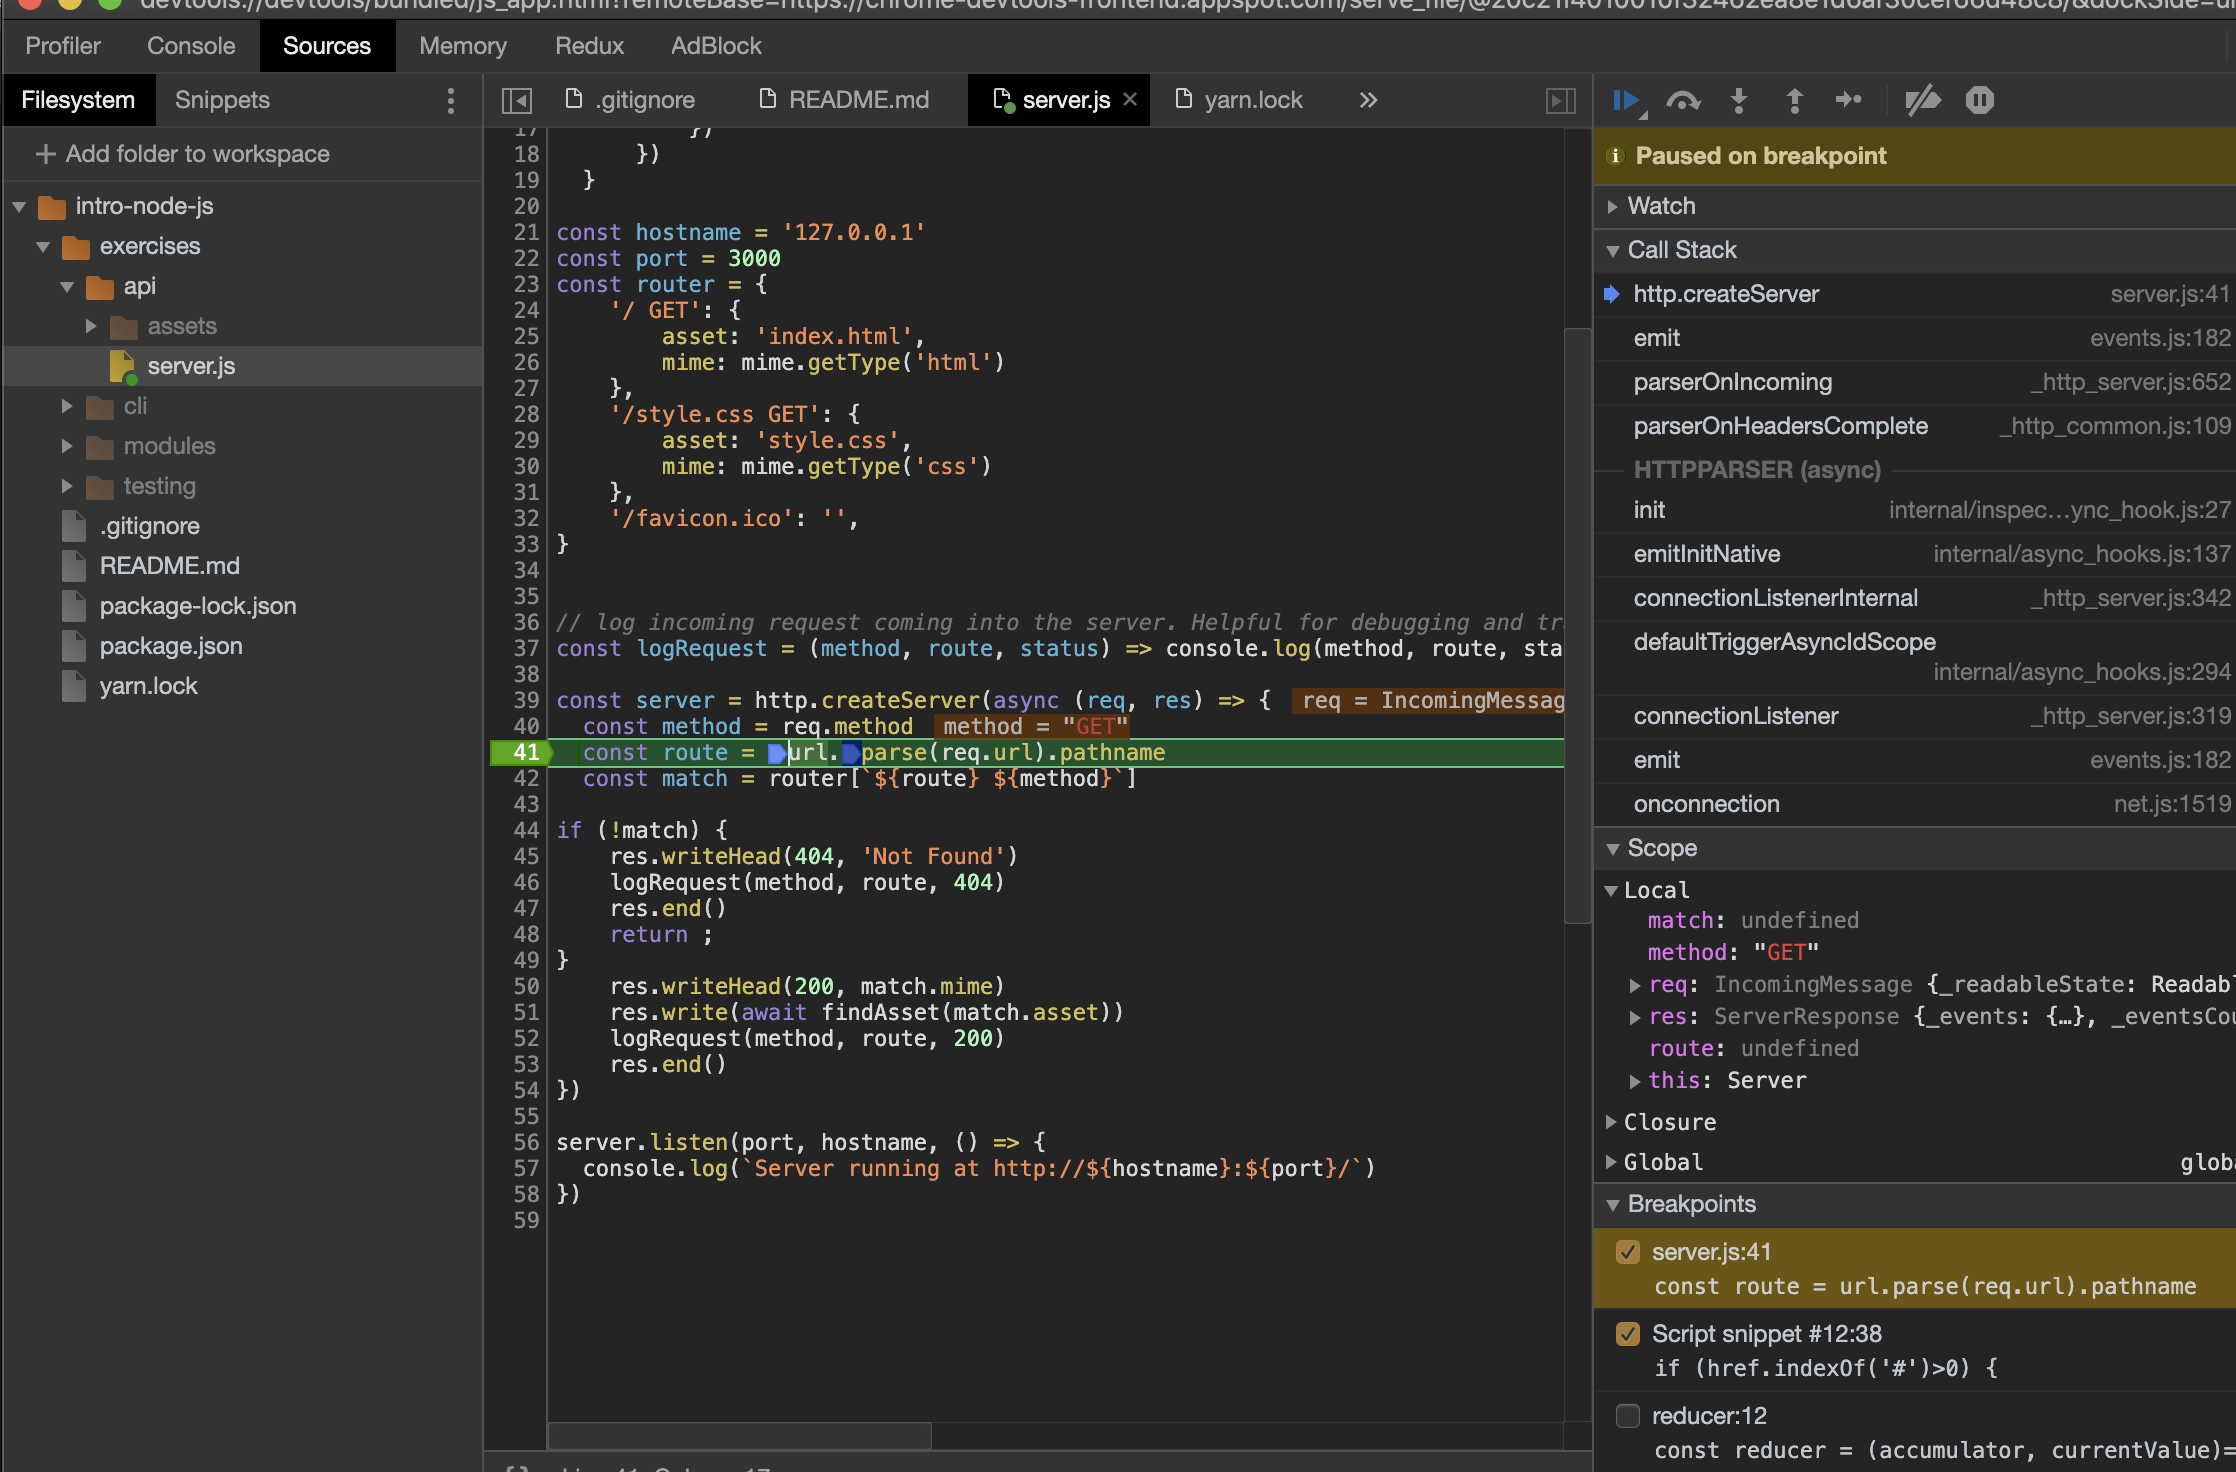
Click “inspect” and it will open a DevTools window.
Note - you may need to manually add the filesystem. Go to Source and select “Add folder to workspace”. The indication that it wasn’t working for me was the error:
Unable to add filesystem permission denied.Once your files are loaded, however, you have full debugging features available.
Hi there and thanks for reading! My name's Stephen. I live in Chicago with my wife, Kate, and dog, Finn. Want more? See about and get in touch!